
DataPOD · data + AI foundation
Big spatial data needs
somewhere to live.
Spatial studies generate a lot of data, fast. Images, measurements, analyses and everything in between. DataPOD gives it a managed home, with storage, organization and access handled by us, so you can stay focused on the biology.
One cohort, end to end
4.8 terabytes
Raw imaging in — H&E plus 60-plex multiplex
In
2.3+ million
Single cells out, each with 60 markers and coordinates
Out
10 years
Retained, versioned and access-logged
Kept
From tissue to storage
Your study keeps moving.
The data keeps growing.
Follow one spatial study as its data grows. DataPOD keeps everything organized and managed underneath.
Managed data footprint
201 GB
+201 GB
one tissue
The study
Submitted
A whole slide arrives.
A 200 GB image is only the beginning.
Moving into DataPOD
H&E.tiff
1 GB
→
60_plex_mIHC.ome.tiff
200 GB
→
meta_data.xlsx
1 MB
→
Regions marked on the H&E
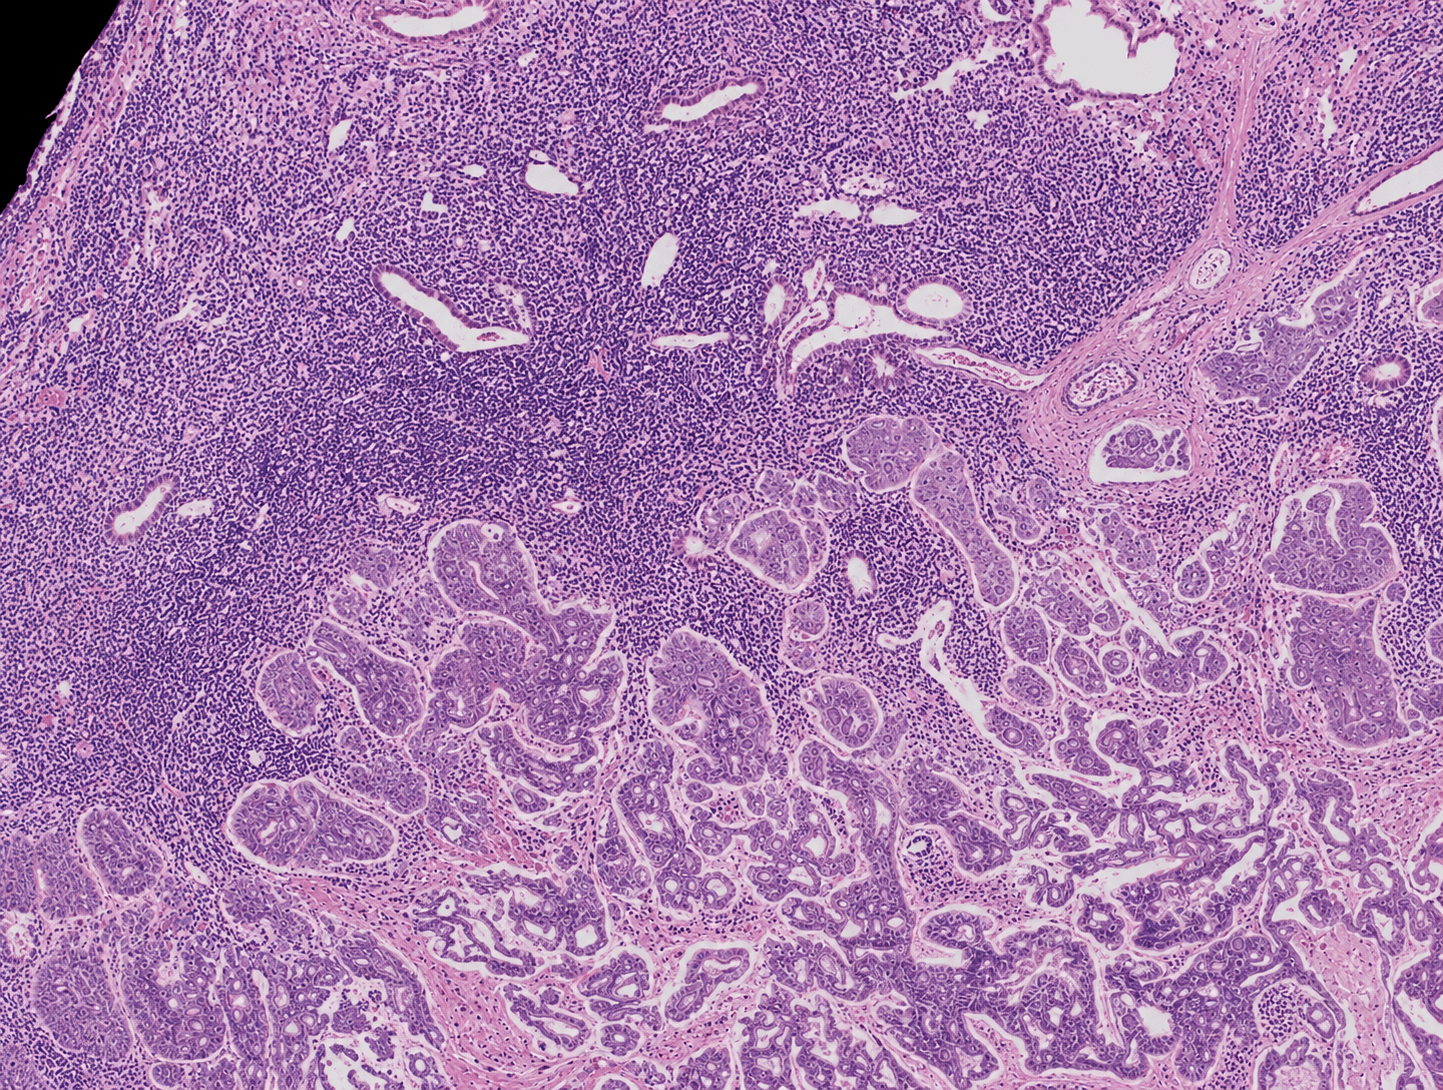
H&E
Tumor · Stroma
→
Map
60-marker mIHC
Same coordinates
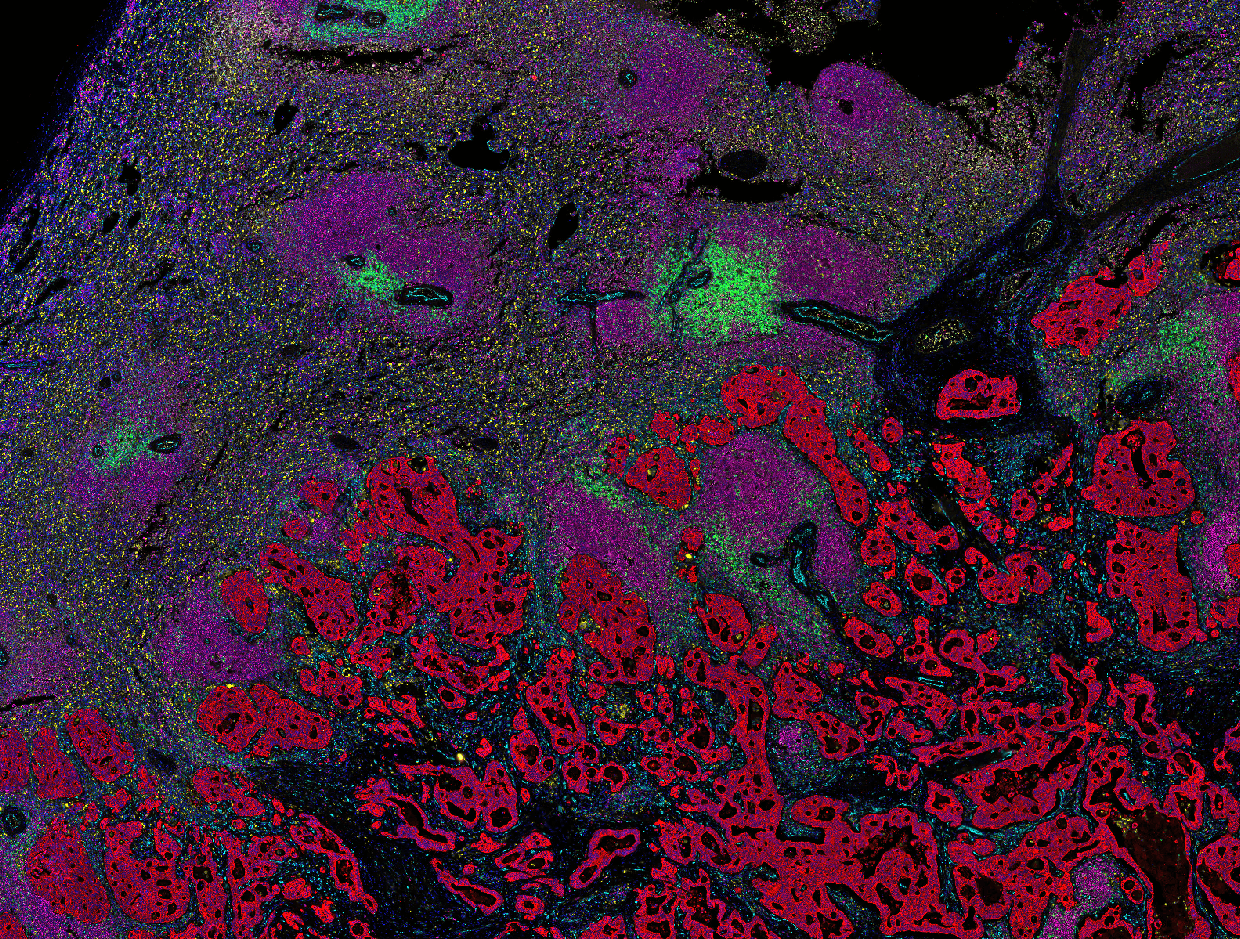
60
markers on the same section
96,523
cells, each with a position, 60 measurements and 60 scores
Cell 018,492
X 12,842 · Y 7,291
60 / 60 markers quantified60 / 60 markers scored
MarkerIntensityPositivity
CD3
8.42
+
CD8
7.91
+
CD20
0.84
−
PD-L1
2.76
+
…
…
…
60 markersquantifiedscored
The cohort
+23 new patients
~2.32M
single cells across the cohort
All source images, annotations, mapped regions and analysis outputs stay organized by patient and cohort.
Input
cell coordinates
60-marker quantification
60-marker positivity
↓
InSights
Analysis, run across the cohort
cell phenotypes
spatial neighborhoods
cell–cell relationships
proximity / exclusion
regional comparisons
↓
Outputs
~3.4 GB
total analysis outputs, back into the study
Back into the study
phenotypes
370 MB
niches_neighbourhoods
950 MB
spatial_signatures
590 MB
analysis_table_stats
270 MB
plots_heatmaps_figures
420 MB
figure_source_data
800 MB
Who can reach it
Your teamFull access ✓
CollaboratorAccess granted
Retention
5 years online
5 years cold storage
In DataPOD
3 objects managed
Organized as it arrives, nothing for your team to manage
A lot of data. Very little drama.
Data, taken care of.
Spatial data gets big fast. DataPOD keeps it stored, organized and accessible, without your team managing the infrastructure.
Store
Built for large spatial datasets.
Control
The right data, with the right people.
Keep
Managed beyond the life of the study.
Your biology is complicated enough.
Your data shouldn't be.
From the first image to downstream analysis and translation, we keep the data managed and accessible.